Key Takeaways:
- The 1.2 percentage point gap between average and top-performing Indian D2C brands is worth tens of lakhs every month per brand. The source of that gap is almost never what most growth teams are focused on fixing.
- India's 45% COD rate is one of the most misread signals in D2C. Understanding what it actually represents changes where you intervene and the unit economics of doing so.
- The way most D2C brands have implemented flexible payment options is fundamentally different from how top performers use it. The distinction is not about having the feature. It is about where it appears.
- There is a specific buyer segment that is currently visiting your store, wanting your products, and not converting. It is not a traffic problem. The data from brands that have closed this gap is consistent.
- The brands reaching 3% and above conversion in Indian D2C are not spending more on acquisition. They have made different infrastructure bets. This article identifies the three that consistently separate them.
Introduction
Take a brand with 50,000 monthly sessions and a Rs 2,000 AOV. At 1.8% conversion, that is Rs 18 lakh in monthly GMV. At 3%, it is Rs 30 lakh. From the same sessions. The same ads. The same products.
The Rs 12 lakh difference is not waiting on a better campaign, a lower CPM, or a new influencer tie-up. It is sitting inside the checkout that most of those 50,000 visitors hit and abandoned. This is not a growth problem. It is a structural one, and it has a different kind of fix.
The distance between 1.8% and 3% in Indian D2C comes down to three infrastructure decisions that almost every underperforming brand gets wrong in the same way. The brands at 3.5% are not winning because they have better products. They are winning because they have made different bets on how their store actually functions for the specific shopper who buys in India in 2026.
Fix 1: Mobile Checkout. Where 78% of Your Traffic Goes to Die.
78% of Indian D2C traffic arrives on mobile. That much is widely cited. What’s less discussed is what it means structurally.
Sit with that for a moment. Every rupee your brand spends on Meta ads, influencer campaigns, and SEO is driving traffic that is almost entirely mobile, and that traffic is converting at less than half the rate of the small slice that comes in on desktop. This is not a traffic quality problem. It is where your funnel actually breaks.
The cause is not screening size. It is a tapping count. The average Indian D2C mobile checkout has six to eight steps before payment confirmation. Each additional step loses 10-15% of the shoppers who made it that far.
On a mid-range Android with spotty connectivity, how most non-metro India shops, a checkout page that takes 3 seconds instead of 1 second does not just feel slow. It bleeds conversion. Google's research puts the probability of abandonment at 32% higher for a 3-second page versus a 1-second page. For a shopper already on the fence, that is the exit.
The structural fix: a single-page checkout, auto-fill on UPI ID and saved addresses, and tap targets built for thumbs. Benchmark your load time on a mid-range Android on 4G, not a Wi-Fi iPhone. The gap between what your checkout feels like in your office and what it feels like on a Redmi in Nagpur is where conversions are dying.
Getting these right moves mobile conversion from 1.2% to somewhere between 1.8% and 2.2%. For a brand with 80,000 monthly mobile sessions at Rs 1,500 AOV, that is Rs 7.2 lakh a month. The traffic budget has not changed. The checkout does.
Fix 2: Trust Signals. Why 68% of Indian Shoppers Prioritise Trust Over Price.
68% of Indian online shoppers cite trust signals as the primary factor in their purchase decision. Not price. Trust.
That number explains COD better than any logistics analysis does. When 45% of D2C orders are still cash on delivery in 2026, it is not because shoppers prefer handling cash at the door. It is because prepaid feels like a risk they have not decided to take yet. The product page has not earned it. The checkout has not either.
Three things change this, none of them require a developer.
-
Photo reviews with verified purchase labels. Text reviews are largely ignored by Indian shoppers; they have seen enough fake ones. A photo with a verified purchase badges is a different signal entirely.
-
Your return policy is probably in your footer. Nobody is reading it there. The shopper wants to know about returns before they add to cart, not while they are tracking a delivery. One line on the product page, "Easy 7-day returns," moves ATC more than most brands expect because it is answering a question the shopper was already carrying.
-
"UPI Secured" near the payment button. It is obvious. Most checkouts either skip it or bury it below the fold on mobile, which means the shopper who needs the reassurance most never sees it. The label does not need to be big. It just needs to be next to where the money moves.
Together, these three changes typically add 0.2-0.4 percentage points to conversion. They are free. They take an afternoon. Most brands have not done all three.

Fix 3: Payment Architecture. The Conversion Gap No One Talks About.
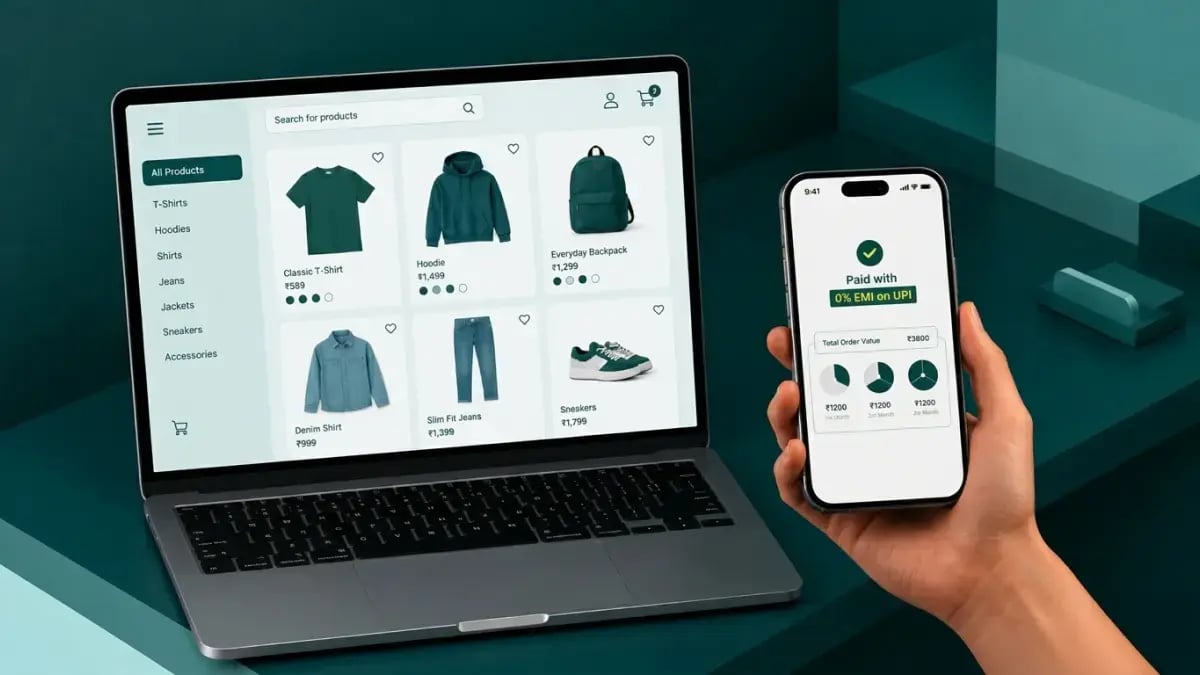
A shopper who wants a Rs 2,500 jacket sees the full price at your checkout. On Amazon, they see Rs 833 a month. That is not a price difference. That is a payment architecture difference, and it is costing you the sale before the shopper even reaches checkout.
When UPI is the primary payment option, Indian shoppers convert 34% more. UPI being available is now the baseline.
The brands converting at 3%+ have gone one step further: They show EMI pricing at the product listing page and the product detail page, not just at checkout. When a shopper sees Rs 833/month next to the product image, they frame the decision differently. By the time they reach checkout, the purchase is already decided. Most D2C brands are still treating EMI as a checkout option. Top performers are treating it as a product page message.
The data is consistent across brands that have made this shift:
-
Blue Tyga added Snapmint 0% EMI across all three touchpoints: the listing page, the product page, and the checkout. The conversion rate went up 21%, with the sharpest gains on SKUs above Rs 1,200.
- Mini Wesst grew monthly GMV by 45%. The more interesting number: nearly half of those Snapmint orders came from Tier 2 and Tier 3 cities. Buyers who had been stopping at Rs 4,599 did not stop at Rs 1,533 a month.
How the merchant side works:
Snapmint is an RBI-licensed NBFC. 0% EMI on UPI, flexible tenures of 3, 6, or 9 months, instant approval, no credit card needed. One integration activates all three touchpoints.
Two things that matter commercially: the merchant receives full upfront settlement at the time of purchase, 100% of the order value, immediately. And Snapmint absorbs the credit risk entirely. The brand's unit economics look identical to any other prepaid UPI order. The COD return liability disappears.
90% approval rate. Rs 5,000 crore disbursed. 2,000+ brand partners. The same infrastructure runs Pay Later at Ixigo, Zepto, and Magicpin.
The Revenue Math: What Closing the Conversion Gap Is Actually Worth
Here is what the gap actually costs.
A brand with 50,000 monthly sessions and Rs 2,000 AOV, at 1.8% conversion, does Rs 18 lakh a month in GMV. At 3%, that is Rs 30 lakh. The difference is Rs 12 lakh a month from traffic that is already arriving and already being paid for.
| Scenario | Orders/Month | Monthly GMV |
| Current Stat: 1.8% CVR | 900 | Rs 18,00,000 |
| With all 3 fixes: 3% CVR | 1,500 | Rs 30,00,000 |
| Additional GMV | Rs 12,00,000 / month: same traffic, no extra ad spend | |
The three fixes are not equivalent in effort or timeline. Trust signals, copy and placement changes, can be live this week. Payment architecture is a single integration, typically a few days, with measurable conversion impact on anything above Rs 1,500 AOV. Mobile checkout is the bigger development project, but it compounds: every subsequent campaign, every future traffic spike, converts better.
Start with trust signals. Move to payment architecture. Build mobile checkout properly. None of these require more traffic. They require better use of what you already have.
.png?width=1700&height=616&name=Group%201597882553%20(1).png)
FAQs